

Disclosure focus
This disclosure asks an organisation to report the greenhouse gas emissions linked to the electricity, heat, steam or cooling it buys and uses, rather than emissions it creates directly on site. In practice, it is about showing the climate impact of purchased energy in a way that is clear, consistent and based on the organisation’s reporting boundary.
The practical focus is usually on coverage across the organisation’s operations, not just a few flagship locations. Readers will want to understand whether the figure includes all relevant sites and activities, how the organisation has treated different energy sources, and whether the reporting approach is consistent from one period to the next.
This LRA educational guidance supports disclosure preparation. For the exact requirements, always refer to the official GRI source.
Before you start
A quick mental checklist before you prepare this disclosure — tick each as you settle it.
Preparation
Key information to prepare
+ Show GRI 305-2 sub-elements (LRA working checklist)
State whether market-based Scope 2 emissions are relevant for the reporting period.
Set out the boundary method used to combine emissions data across the organisation.
Report the emissions figure used for the chosen base year.
Give the opening date for the base-year period.
Provide the location-based Scope 2 emissions total.
Provide the market-based Scope 2 emissions total.
Where relevant data exists, identify which gases were included in the calculation.
Name the source used for the emission factors.
Describe the methods, assumptions, standards and calculation tools applied.
Give the closing date for the base-year period.
Explain what changed materially and why that led to a base-year restatement.
State the warming potential values used, or point to the source they came from.
Explain why that base year was selected.
How to prepare it
1Set the reporting boundary first: decide which operations and energy purchases sit inside the calculation, and make the consolidation method explicit so the figures are built on one consistent basis.
2Define what you will count in the two Scope 2 views. Prepare the location-based total, then check whether a market-based total applies and, if it does, calculate and record that figure separately.
3Gather the supporting records for the calculation inputs. Keep the emission-factor source, the global warming potential values used or where they came from, and the standards, methods, assumptions, and tools behind the numbers.
4Compile the output in the required formats. Report the emissions total for the base year, include the base-year start and end dates, and state the gases used in the calculation where that information is available.
5Explain the base-year choice and any later restatements. Note why that year was selected, and describe the circumstances behind any major emissions change that led you to recalculate the base-year figure.
6Check the draft against the source records before sign-off. Confirm the numbers, dates, and narrative all align with the underlying evidence and that nothing material has been omitted or mis-stated.
Request the data
Request the site electricity and emissions data from Operations
Translate the disclosure into an internal business question — then adapt it to your organisation's own language.
What are our purchased-energy emissions for the reporting period, and what method details do we need to explain how they were calculated and whether any prior-year figures need updating?
Use your organisation’s own terms first, then map them to the reporting disclosure. For example, ask for site power, utility, and emissions calculation data in the language your teams already use, rather than using framework labels in the first ask.
Weak request
Please provide the Scope 2 GHG emissions disclosure data, including location-based and market-based emissions, base year information, emission factors, GWPs, consolidation approach, and methodologies.
Why it fails: It uses framework language first, which may not match how the operational team stores or talks about the data. It also does not tell the owner what systems, sites, period, or supporting evidence to pull, so the response is likely to be incomplete or hard to use.
Better request
Please send the electricity and emissions figures your team already tracks for [reporting period] for [sites/business unit], plus the supporting export or workbook. Include the total emissions figure in tCO2e, any supplier-based figure if available, the gases included, base-year dates and rationale, any recalculation explanation, the factor source, the GWP source or reference, the boundary used, and the calculation notes/tools. Return it in your usual format and we will map it into the reporting pack.
Industry examples
Draft your disclosure
Notes that turn data into a disclosure
LRA training templates — adapt them to your organisation, and check the official source before sign-off.
Method note
Set out the gases counted, the organisational boundary approach used, the emissions factors and warming values applied, the calculation method or tool relied on, and the dates and reason for the chosen comparison year.
Context note
Explain what the reported electricity-related emissions figures represent, including whether both accounting bases are relevant and how the chosen reference year and current period help readers interpret the result.
Fluctuation statement
If the comparison year was revised, briefly explain the operational or methodological change that caused the restatement and how that affects the reported trend.
Content index entry
GRI 305-2 Energy indirect (Scope 2) GHG emissions — [location / page] / [notes]
Download Centre
Preparation tools & forms
Professional preparation tools for GRI 305-2 — free with an LRA Community membership. Register once (it's free) and every download unlocks, together with the Disclosure Library, templates and the LRA AI Assistant.
Free · Community members
Assurance readiness
For each claim, check the evidence
Evidence pack to prepare
Common reporting gaps
Figures are stated without the supporting narrative, or narrative without figures.Scope is inconsistent between the text and the numbers.The reporting boundary is left undefined.Material changes since the previous period are not disclosed.Estimates and measured values are not distinguished.Source records for the figures are not identified.
Common gaps
Mistakes to avoid when collecting the data
Wrong owner, wrong language
People ask the emissions question in framework terms instead of the business team’s own wording, so the person who holds the electricity or utility records never realises they are the right source.
No clear boundary
The team starts collecting figures before agreeing which sites, meters, contracts, or entities sit inside the reporting boundary, so the numbers later mix unlike populations.
Period mismatch
One part of the file uses the reporting year while another uses a different cut-off or invoice window, which leaves the final set built from different time bases.
Counting basis mixed up
Location-based and contract-based figures are pulled into the same working sheet without a clear split, so the two calculation routes become impossible to separate cleanly.
Source labels stripped out
Original file names, meter IDs, supplier references, or factor references are removed during copying, so nobody can trace a figure back to the record it came from.
Separate populations merged
Data from sites with different electricity arrangements is rolled into one total too early, which hides whether each group should be handled on its own.
Evidence details not captured
The team saves the number but not the supporting context, such as the source document, date, version, or calculation note, so the figure cannot be checked later.
No sign-off trail
Figures move between teams without a named reviewer or approval record, so there is no clear trail showing who checked the inputs before the disclosure draft was built.
Base-year records incomplete
The start and end dates, reason for the chosen reference year, and any later recalculation context are not gathered together, so the baseline cannot be explained or defended.
Factors and method left vague
The source of the emission factors, the warming-rate reference, and the calculation approach are not recorded at collection stage, so the working papers do not show how the total was built.
Where judgement is often needed
Acquisition or disposal during the year
Decide whether to include bought-in or sold-off operations from the date control changes, explain the cut-off used, and show any knock-on effect on the base-year figure if you restate it.
Different country electricity rules and labels
Where local grid data, supplier factors, or certificate rules vary by country, use a consistent rule set for each site, state the source for each factor, and explain any country-by-country differences.
Sites partly inside the reporting perimeter
For shared buildings, joint ventures, leased assets, or other mixed-use arrangements, set out the share of energy you have counted, the basis for that split, and why that approach fits your boundary policy.
Choosing the base year and its dates
Pick a base year that gives a stable comparison point, record the start and end dates, and explain why that period was selected rather than another year.
When to restate the base year after a major change
If a significant event changes the footprint or calculation basis, explain whether you have recalculated the base year, what triggered it, and the size of the adjustment.
Measured data versus estimates
If meter reads are missing or incomplete, use a documented estimate method, identify which parts are estimated, and disclose the calculation approach and any material uncertainty.
Which gases are included in the calculation
If more than one gas is relevant and data are available, list the gases actually used, or say that only the available gases were included and why.
Rounding and presentation of totals
Apply one rounding rule across the report, keep the underlying calculation trail unrounded, and note the rounding basis if it could change the reported total by a visible amount.
Aggregating sensitive site data
If site-level energy data could reveal commercially sensitive or personal information, combine it to a higher level only where that still supports the disclosure, and explain the aggregation rule used.
Examples
Illustrative examples
Synthetic, written by LRA — not from a company report, not text from any standard.
Illustrative (synthetic) example — Manufacturing
We have used a 1 January 2022 to 31 December 2022 base period, chosen because it was the first year with complete energy and emissions data after we expanded our reporting boundary. Our base-year emissions were 48,000 tCO2e; after a 2023 acquisition and a correction to electricity data, we recalculated that figure to 51,200 tCO2e, and the change was driven by the new sites and improved meter coverage.
- For the current year, our location-based Scope 2 total was 22,400 tCO2e, and market-based reporting also applies for us; the market-based figure was 19,600 tCO2e.
- We included carbon dioxide, methane, and nitrous oxide in the calculation, used emission factors from the UK Government conversion factors and supplier-specific electricity data where available, applied 100-year warming values from the IPCC assessment report, and calculated emissions on a financial-control basis using spreadsheet models with activity data from utility bills and meter reads.
This example shows how a reporter can explain the base year, any recalculation trigger, the gases counted, the factor sources, the warming-value source, the consolidation basis, and the methods/tools used, while also stating both Scope 2 totals and whether market-based reporting is relevant.
Illustrative (synthetic) example — Retail
We set 1 July 2021 to 30 June 2022 as our base period because it aligned with the first year in which our store portfolio and leased offices were measured on a consistent basis. That base-year total was 12,300 tCO2e; following a 2024 restatement linked to lease boundary updates and corrected landlord electricity data, we revised it to 13,050 tCO2e.
- Our current location-based Scope 2 emissions are 5,800 tCO2e, and market-based reporting is relevant for us; the market-based result is 4,900 tCO2e.
- The calculation covered carbon dioxide and methane, drew on national grid factors plus contractual electricity information, used 100-year warming values from the latest IPCC report, applied an operational-control consolidation approach, and relied on an emissions workbook built from invoices, landlord statements, and site energy records.
This example demonstrates a second plausible reporter with a different base period, a different recalculation reason, and a different consolidation approach, while still covering the same required data points in narrative form.
How companies report GRI 305-2 in practice
Examples of full and partial reporting practice. These are evidence-led reviews, not exact disclosure templates to copy.
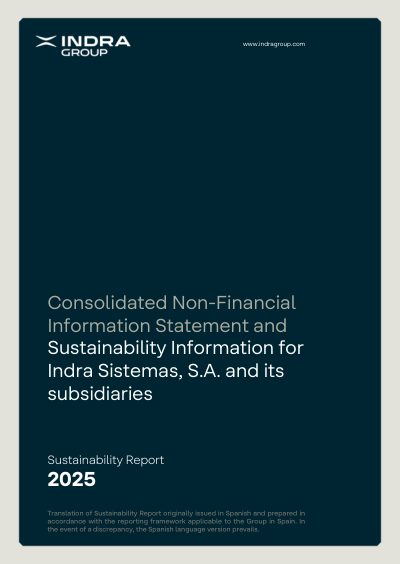
Indra Sistemas, S.A.
Software and Services · Spain · 2025
Indra Sistemas, S.A.'s Sustainability Report 2025 provides reported values for gross Scope 1, 2, and 3 greenhouse gas emissions in tCO2e, including both location-based and market-based Scope 1 and 2 emissions, as detailed on page 74. Additional references to gross Scope 1 and location-based Scope 2 emissions, as well as total gross indirect Scope 3 emissions, appear on pages 247 and 248. However, the report lacks quotable narrative explanations or methodological details for these emissions data, with several narrative and methodological items not found or unclear throughout the document.

REN - Redes Energéticas Nacionais, SGPS, S.A.
Water Utilities · Portugal · 2025
REN's Integrated Report 2025 provides specific data on Scope 2 location-based greenhouse gas emissions, with figures detailed on page 181, including a noted 11% increase in these emissions attributed to exceptional circumstances (p.181, p.180). The report includes a narrative on climate change and carbon footprint reduction linked to Scope 2 emissions (p.656), but lacks clear or quotable information on other emissions categories or related narrative items elsewhere in the document. Several expected narrative disclosures and emissions values, particularly for other scopes or methodological explanations, are not found or remain unclear in the report.

SCB X Public Company Limited
Banks / Diverse Financials / Insurance · Thailand · 2024
SCB X Public Company Limited’s 2024 Sustainability Report provides specific reported values for gross location-based and market-based energy indirect (Scope 2) greenhouse gas emissions on page 113. The report also includes targets for GHG reduction, such as a 50% reduction by 2027 and achieving net zero by 2030, mentioned on pages 10, 77, and 78. However, there is no clear narrative or methodological explanation for these emissions figures, and several expected narrative items and emissions data points are not found or remain unclear in the report.
✓ LRA AI Assistant · Human-in-the-loop

Ask the Study Studio AI Assistant about this disclosure
Get practical answers for your reporting context. Your first two answers are free — join LRA Community for free to continue without a limit.
TryHow do I prepare GRI 305-2?What data do I need to collect?Where can I see a real-report example?What mistakes should I avoid?
2 free answers
Check your understanding
Scenarios to work through
A group finance team has one UK office on a supplier-backed electricity contract and two leased sites on standard grid power. The sustainability lead has calculated 1,240 tCO2e using the location-based method, but the market-based figure is still being checked because one contract certificate is missing.
QWhat should the preparer do about the market-based figure and the related narrative if the contract-backed calculation is not yet supportable?
Reveal model answer →Hide answer ↑They should not present a market-based number as if it is settled. First confirm whether that method can be used for the reporting period; if it can, report the figure only once the evidence is complete and explain the basis used. If it cannot be supported, the report should make that clear rather than implying a value that is not evidenced. The location-based total, 1,240 tCO2e, can still be reported with its supporting method.
Why this matters · Do not publish a market-based result unless the underlying evidence and method are ready to stand behind it.
A preparer is updating the prior-year comparison after a site acquisition doubled electricity use mid-year. The base period was 1 January 2023 to 31 December 2023, and the original base-year total was 860 tCO2e; after the acquisition, the recalculated base-year figure is 1,030 tCO2e.
QHow should the preparer explain the base-year information and the reason for the change?
Reveal model answer →Hide answer ↑They should give the base-period dates, state why that year was chosen, and show the original base-year emissions alongside the recalculated amount if the change was significant. The explanation should link the revision to the acquisition and make clear that the earlier figure was updated because the organisational boundary or activity profile changed. In this case, the narrative should explain why 2023 was selected and why the base-year total moved from 860 tCO2e to 1,030 tCO2e.
Why this matters · When a major change alters the comparison year, explain both the original base figure and why it had to be updated.
A reporting team has used a UK government grid factor for purchased electricity and a separate supplier-specific factor for one renewable tariff. Their draft note says only that 'standard conversion factors were applied', and it does not mention the warming values used for methane and nitrous oxide.
QWhat level of method detail should be added before sign-off?
Reveal model answer →Hide answer ↑The note should identify where the emission factors came from and describe the calculation approach clearly enough for a reader to understand how the total was built. It should also state the warming values used, or point to the source for those values, rather than leaving that part out. A vague statement such as 'standard conversion factors were applied' is not enough on its own.
Why this matters · Readers need enough method detail to trace the calculation, including the factor source and the warming values used.
A multinational has emissions from subsidiaries that are fully controlled in some countries and proportionally shared in others. The team has calculated 4,500 tCO2e on one basis and 3,900 tCO2e on another, but the draft report does not say which consolidation approach was used or which calculation tools supported the result.
QWhat should the preparer disclose so the Scope 2 figure can be understood properly?
Reveal model answer →Hide answer ↑They should state the consolidation approach used for the emissions total and describe the standards, assumptions, and tools that shaped the calculation. If the organisation used a control-based approach, equity share, or another internal rule, that should be made clear in plain language. The report should also explain the calculation tools or spreadsheets relied on so the 4,500 tCO2e or 3,900 tCO2e figure can be interpreted in context.
Why this matters · The same emissions data can mean different things depending on the consolidation basis, so that basis must be made explicit.
Framework references
Relevant GRI requirements and related disclosures
Available framework references and nearby disclosures relevant to preparing this requirement.
Primary
Related & explore
FAQ
Questions this page answers
What do I need to gather before drafting GRI 305-2 emissions data for this page?+−
Start with the datapoints listed on the page: location-based Scope 2 total, whether market-based Scope 2 applies, market-based Scope 2 total if relevant, gases included, base year dates and reason, base year emissions, recalculation context, emission factor source, GWP source, consolidation basis, and calculation method details. The page also gives a step-by-step preparation section to help you organise the work.
How do I use the step-by-step 'how to prepare' section for GRI 305-2?+−
Use it as a practical checklist to move from raw emissions information to a draft disclosure. It is designed to help you prepare the data, set the scope and methodology, and get the disclosure into a report-ready shape.
Which data owner should provide the Scope 2 emissions inputs for GRI 305-2?+−
The page is set up for practitioner use, so the right owner is whoever holds the emissions data, methodology details, and supporting evidence in your organisation. It is useful for sustainability/ESG managers, HR or data owners, and assurance reviewers to coordinate on the same workbook and evidence pack.
What evidence should I keep to make a GRI 305-2 emissions disclosure assurance-ready?+−
The page includes an evidence pack with five items to support assurance readiness, plus six assurance claims to verify. Use those together so you can show the source data, methodology, and supporting records behind the numbers.
What are the six assurance claims I should check for GRI 305-2 emissions?+−
The page says there are six assurance claims to verify, each with a claim, risk, and evidence prompt. Use them as a review checklist to test whether the disclosure is complete, consistent, and backed by evidence before it goes into the report.
What are the common mistakes or reporting gaps to avoid in a GRI 305-2 emissions disclosure?+−
The page lists common reporting gaps and mistakes so you can spot issues before drafting. Use that section to check for missing datapoints, weak methodology notes, or gaps between the figures and the evidence pack.
How do I turn the GRI 305-2 emissions data into a draft disclosure?+−
The page includes a draft-output section with visualisation ideas, narrative starters, and a GRI content-index line. That gives you a practical starting point for turning the prepared data into report text and a simple presentation of the numbers.
Is there an example I can copy when drafting GRI 305-2 emissions?+−
Yes, the page includes synthetic illustrative example disclosures, including a quantitative data table. They are there to show how the disclosure can look in practice, but they are clearly illustrative rather than real company data.
How do I use the Prep & Assurance workbook for GRI 305-2 emissions?+−
The Download Centre includes a Prep & Assurance workbook in .xlsx format and a printable Library Card in .pdf format. Use the workbook to organise the datapoints, methodology, and evidence needed to build a draft and support assurance.
What is the printable Library Card for GRI 305-2 emissions used for?+−
The Download Centre provides a printable Library Card in PDF format alongside the workbook. It is there as a quick reference for the disclosure page content, so you can keep the key preparation points and evidence prompts to hand.
Can I reuse my GRI 305-2 emissions data for ESRS E1 climate reporting?+−
The page notes ESRS E1 (Climate Change) as the closest correspondence, so the data may be reusable across both contexts. It does not say the requirements are identical, so you should still check the other framework’s own needs before relying on the same dataset.
More questions this page can help with
GRI 305-2 emissions workbook how to fill in location-based Scope 2 totalGRI 305-2 market-based Scope 2 applicability when do I include itGRI 305-2 base year emissions and recalculation context what should I documentGRI 305-2 emission factor source and GWP source what evidence do I needGRI 305-2 emissions consolidation basis explained for reporting teamsGRI 305-2 calculation method details what should be included in the draftGRI 305-2 assurance evidence pack what documents should I keepGRI 305-2 common mistakes in emissions reporting to check before submissionGRI 305-2 example disclosure synthetic data table how to use itGRI 305-2 content index line how to draft itGRI 305-2 download centre workbook pdf what is includedGRI 305-2 emissions data owner checklist for sustainability reporting
How this library is built
312 published reports indexed
63171 pages with page-level citations
272 practitioner guides
Free · LRA Community
Get your GRI 305-2 tools — free
Your preparation tools are free for LRA Community members and students. Register once (it's free) and your download starts right away — plus the Disclosure Library, templates and the LRA AI Assistant.
✓
You're in — your download is starting
Your file is downloading now. Your Community Cabinet — with the Disclosure Library, templates and the LRA AI Assistant — is ready too.
Open your Cabinet →