

Disclosure focus
This disclosure asks an organisation to explain whether it has programmes that help employees build new skills or move into different work, and whether it provides support for people whose jobs are changing or ending. The focus is on the practical arrangements in place, not just a policy statement: what the programmes are, who can use them, and what kind of help they provide.
In practice, the reporting should show the breadth of coverage across the organisation. That means clarifying whether these programmes apply only in certain locations, business units or employee groups, or whether they are available more widely across operations. If coverage is uneven, it is useful to explain where the gaps are and why they exist.
This LRA educational guidance supports disclosure preparation. For the exact requirements, always refer to the official GRI source.
Before you start
A quick mental checklist before you prepare this disclosure — tick each as you settle it.
Preparation
Key information to prepare
+ Show GRI 404-2 sub-elements (LRA working checklist)
Offer support that helps people stay employable and manage the end of their working life when they retire or leave the organisation.
Set out what learning or development programmes you run, and what help you give, to improve employees’ skills.
How to prepare it
1Set the reporting boundary first: decide which workforce groups, locations, and time period the disclosure will cover, and make sure that choice is applied consistently across both parts of the item.
2Define the two content buckets in plain terms: one for skills-upgrading support given to employees, and one for help offered when people are leaving work or moving toward retirement, so the reporting team uses the same interpretation throughout.
3Gather the underlying records for each bucket: programme descriptions, participant lists or counts, dates, delivery notes, and any internal approvals or policy documents that show the support was actually provided.
4Compile the disclosure in the format you will publish: for the first part, state the kind of support and how broad it was; for the second, describe the transition support and how it helped people remain employable or manage the end of employment.
5Record any exclusions, scope changes, or one-off adjustments clearly, including what was left out and why, so a reviewer can see how the final figures or narrative were built.
6Check the draft against the official source and your evidence pack line by line, confirming that the wording, scope, and supporting material match the underlying requirement before sign-off.
Request the data
Request the learning and exit-support evidence
Translate the disclosure into an internal business question — then adapt it to your organisation's own language.
What people-development and exit-support arrangements did we run in the period, and what proof do we have for them?
Use your organisation’s own labels first, then map them to the disclosure. For example, you may talk about learning, capability building, redeployment support, retirement support, or leaver support rather than using framework terms in the request.
Weak request
Please send anything you have for GRI 404-2 on employee skills programmes and transition assistance.
Why it fails: It uses framework language only, gives no boundary or period, and does not tell the owner what records to pull or how to describe them in the organisation’s own terms.
Better request
Please send the [period] evidence for our learning, capability-building, redeployment, retirement, and leaver-support activity in [business area]. Include the programme names you use internally, who was covered, how it was delivered, the source record, and any exclusions or changes. I’ll map it for reporting and check the official source before sign-off.
Industry examples
Draft your disclosure
Notes that turn data into a disclosure
LRA training templates — adapt them to your organisation, and check the official source before sign-off.
Method note
Define the reporting boundary, the employee groups included, and the basis used to count each support activity so readers can see what was treated as a programme and what was treated as assistance.
Context note
Explain what the figures show about how the organisation helped people build skills for ongoing work and supported those approaching retirement or leaving employment.
Fluctuation statement
If the mix or volume changed materially, note whether this was driven by changes in workforce needs, programme design, or the number of employees using the support.
Content index entry
GRI 404-2 Programs for upgrading employee skills and transition assistance programs — [location / page] / [notes]
Download Centre
Preparation tools & forms
Professional preparation tools for GRI 404-2 — free with an LRA Community membership. Register once (it's free) and every download unlocks, together with the Disclosure Library, templates and the LRA AI Assistant.
Free · Community members
Assurance readiness
For each claim, check the evidence
Evidence pack to prepare
Common reporting gaps
The information is presented without a date or as-at point.The scope or boundary of the statement is left undefined.Key terms are used inconsistently across the report.Material changes since the previous period are not disclosed.Assertions are made without supporting detail or a source record.Boilerplate is used that does not actually answer what is asked.
Common gaps
Mistakes to avoid when collecting the data
Wrong owner
The request goes to HR or L&D in framework language, but the real source sits with the teams that run training, redeployment, retirement support, or exit support.
Scope left vague
No one agrees whether the data covers the whole organisation, only certain sites, or just selected employee groups, so the final pull is not comparable.
Period basis mixed up
One team reports by calendar year while another uses the financial year or a rolling period, which makes the combined dataset inconsistent.
Counting basis not aligned
Headcount, participant numbers, and course attendances are blended together without a clear rule, so the same person can be counted in different ways.
Source labels stripped out
Original names from the training system, exit-support tracker, or local spreadsheet are replaced too early, making it hard to trace each figure back to its source.
Different populations merged
Skills-upgrade activity for current staff is combined with support for people leaving the business, even though those two groups need separate treatment.
Evidence details missing
The file shows a number but not the supporting date, owner, version, or system reference, so the figure cannot be checked later.
No sign-off trail
Draft figures move by email or chat without a named reviewer and approval record, so nobody can show who checked the data before it was used.
Where judgement is often needed
What counts as a skills-upgrade programme
Decide whether to include only structured learning offered by the organisation or also coaching, mentoring, job rotation and similar support, then explain the rule you used and keep it consistent across sites.
Which people sit inside the reporting boundary
Set out whether you include permanent staff only or also fixed-term, part-time, agency and other workers where they are part of your people model, and disclose any exclusions or separate treatment.
How to handle businesses added or sold during the year
Use a clear cut-off for acquisitions and disposals, explain whether you include activity only from the date control changed, and note any material boundary shifts that affect comparability.
Different country labels for the same support
Where local operations use different names or legal categories for similar learning or career-end support, map them to one internal definition, explain the mapping, and flag any local exceptions.
Whether career-end support covers retirement and exits alike
State whether your exit-support figure includes retirement, redundancy, dismissal and other departures, or only some of them, and describe the basis for any split between groups.
Choosing the measurement basis for activity levels
If you report counts, participation, spend or another basis, explain the method chosen, whether estimates were used for any part of the data, and how you treated partial-year activity.
Rounding and small-number suppression
Apply one rounding rule across the dataset, disclose it, and if small numbers are hidden for privacy or practicality, say so and make clear that totals still reflect the underlying population.
Protecting personal data in small teams
When a local team is too small to show detailed breakdowns safely, aggregate the figures to a higher level, explain the grouping approach, and keep the reported totals internally consistent.
Examples
Illustrative examples
Synthetic, written by LRA — not from a company report, not text from any standard.
Illustrative (synthetic) example — Manufacturing
We ran a mix of in-role learning and formal development support for 420 employees, covering technical refreshers, digital tools, and supervisory skills; 315 people took part, and 210 completed more than one activity. We also offered career-end support to 38 colleagues whose employment ended through retirement or redundancy, including guidance on next steps, CV help, and access to external advice; 29 used at least one service, and 12 joined a follow-up session after leaving.
This example shows how to describe both capability-building support for current staff and practical help for people leaving the business, using plain language and internally consistent figures.
Illustrative (synthetic) example — Healthcare services
Our group provided learning support to 260 staff through classroom sessions, coaching, and funded qualifications aimed at clinical, digital, and people-management skills; 198 employees used the offer, and 144 completed two or more elements. For colleagues whose roles ended because of retirement or organisational change, we provided transition help such as retirement planning, job-search guidance, and signposting to outside services; 41 people were eligible, 33 accepted support, and 9 attended a post-exit check-in.
This example combines upskilling activity with transition assistance for leavers, while keeping the wording distinct from the source and the numbers mathematically consistent.
How companies report GRI 404-2 in practice
Examples of full and partial reporting practice. These are evidence-led reviews, not exact disclosure templates to copy.
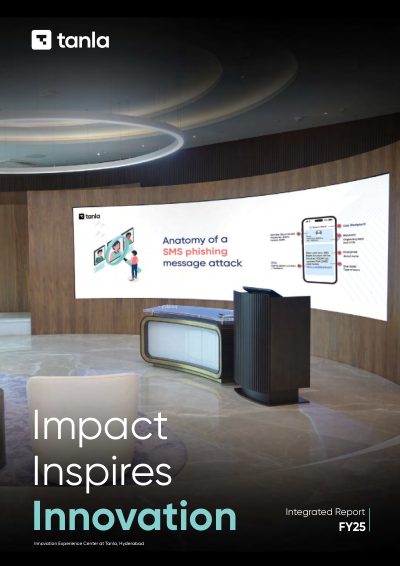
Tanla Platforms Limited
Software and Services · India · 2025
Tanla Platforms Limited’s Integrated Report FY25 provides coverage of employee welfare programs, noting communication channels such as email advisories, newspapers, websites, stock exchange intimations, and in-person meetings on page 216. The report also details programs for upgrading employee skills and transition assistance, referencing GRI 404-2 on page 378, and mentions specific training initiatives including AI/ML training for 269 employees and participation across behavioral and functional training categories (pages 66-67). However, the report does not clearly specify the extent or impact of these welfare programs beyond communication methods, nor does it provide detailed outcomes related to employee transition assistance.
ASE Technology Holding Co., Ltd.
Semiconductors · Taiwan · 2024
ASE Technology Holding Co., Ltd.'s 2024 CSR Report provides information on employee skill development programs, including non-mandatory trainings aimed at improving employee skills (p.253) and talent cultivation initiatives detailed under "6.2 Talent Cultivation and Development ASEH" (p.263). The report mentions various training formats such as new employee training, management academy courses, and self-paced online learning (p.180), as well as specific efforts to enhance knowledge transfer and cross-departmental collaboration (p.182). However, the report does not clearly specify transition assistance programs or detailed metrics on training outcomes, leaving some aspects of employee development unclear.

Firstsource Solutions Limited
Professional Services · India · 2025
Firstsource Solutions Limited's ESG Report FY 2024-25 includes coverage of operational improvements such as SOP navigation, next-best actions, autonomous execution, and an end-to-end claims adjudication system with traceability, as noted on page 33. The report also details employee-related initiatives including retention, talent acquisition, apprenticeships, career mobility programs like FirstLeap and THRIVE, and transition assistance, with information found on pages 96-104 and 128-129. However, while some environmental targets for energy and emissions reduction are mentioned on page 195, the report indicates emissions continue to rise, and the overall progress or impact of these initiatives is not fully clear.
✓ LRA AI Assistant · Human-in-the-loop

Ask the Study Studio AI Assistant about this disclosure
Get practical answers for your reporting context. Your first two answers are free — join LRA Community for free to continue without a limit.
TryHow do I prepare GRI 404-2?What data do I need to collect?Where can I see a real-report example?What mistakes should I avoid?
2 free answers
Check your understanding
Scenarios to work through
A manufacturer ran two in-year initiatives: a digital-skills course for 48 production staff and a mentoring scheme for 12 supervisors moving into team-lead roles. The draft note currently says only that the business 'supports development'.
QWhat should the preparer check before finalising the narrative so it properly describes the training activity?
Reveal model answer →Hide answer ↑The note should spell out the kind of development support given and the reach of that support, rather than leaving it as a general statement. In practice, that means naming the main programme types and the scale or scope of each, so a reader can see what was actually put in place to build employee capability.
Why this matters · Describe the main upskilling activity in plain terms and make the scope visible, not vague.
A services firm offered outplacement workshops, CV clinics and interview coaching to 19 employees whose roles ended after a restructuring. The draft disclosure mentions the restructuring but leaves out the support offered after employment ended.
QHow should the preparer decide whether this belongs in the disclosure and how it should be framed?
Reveal model answer →Hide answer ↑It should be included because the disclosure covers support that helps people stay employable and manage the move out of the business after retirement or job loss. The write-up should identify the transition support provided and link it to that purpose, rather than describing the restructuring alone.
Why this matters · Include post-employment support where it helps people move on and remain employable.
A retailer provided a six-month retraining pathway for 30 store workers, but only 18 completed it before year-end. The draft text says '30 employees completed retraining'.
QWhat is the correct way to handle the numbers and wording in the narrative?
Reveal model answer →Hide answer ↑The preparer should keep the figures internally consistent and distinguish between those offered the programme and those who completed it. If 30 were enrolled and 18 finished, the narrative should say that 30 took part in the pathway and 18 completed it, rather than implying all 30 finished.
Why this matters · Keep participation and completion figures separate and numerically consistent.
A group has a career-ending support package for employees leaving at retirement, but it is only available to staff in one country and only when a manager refers them. The draft disclosure says the group has a 'global transition programme'.
QWhat judgement should the preparer make about describing the programme's scope?
Reveal model answer →Hide answer ↑The description should match the actual reach and conditions of the support. If it is limited by geography or referral route, the narrative should say so, because the disclosure is about the type and scope of support actually provided, not a broader label that overstates coverage.
Why this matters · State the real scope and access conditions of the support, not a broader-sounding label.
Framework references
Relevant GRI requirements and related disclosures
Available framework references and nearby disclosures relevant to preparing this requirement.
Primary
Related & explore
FAQ
Questions this page answers
For GRI 404-2 Training and Education, what data do I need to collect before I start drafting the disclosure?+−
The page says to prepare two datapoints: skills upgrade support and career transition support. Use those as the starting point for your data request, then check the step-by-step preparation section to make sure the scope and evidence are clear.
How do I use the step-by-step 'how to prepare' section for GRI 404-2 Training and Education?+−
Use it as a working checklist rather than a finished answer: it is there to help you organise the disclosure, confirm what data you have, and spot any gaps before drafting. The page is designed as practitioner guidance, so it supports preparation rather than replacing your own process.
What should I include in the evidence pack for GRI 404-2 Training and Education?+−
The page includes an evidence pack with five items to support assurance readiness. Build your pack around those items and make sure they link back to the datapoints, the claims you plan to make, and the underlying source records.
What are the four assurance claims I should verify for GRI 404-2 Training and Education?+−
The page flags four assurance claims to check, each with a claim, risk and evidence prompt. Use them to test whether your draft is supportable and whether the evidence pack actually backs up what you plan to report.
What are the most common mistakes on a GRI 404-2 Training and Education disclosure page?+−
The page lists common reporting gaps and mistakes so you can catch them before sign-off. It is useful for checking whether your scope, wording, evidence and data points are aligned with the draft you are building.
How can I turn the GRI 404-2 Training and Education page into a draft disclosure?+−
Use the draft-output section to move from data to wording: it gives visualisation ideas, narrative starters and a GRI content-index line. That makes it easier to turn the page into a first draft for internal review.
How do I use the synthetic illustrative example for GRI 404-2 Training and Education without copying it blindly?+−
Treat the example as a model for structure and presentation, not as a template for your own figures. The page says the example is synthetic, so you should replace it with your own data and keep any numbers internally consistent.
Where do I find the workbook and printable card for GRI 404-2 Training and Education, and what are they for?+−
The Download Centre includes a Prep & Assurance workbook in .xlsx format and a printable Library Card in .pdf format. Use the workbook to organise preparation and assurance checks, and the card as a quick reference while drafting.
How should an HR or data owner use the GRI 404-2 Training and Education page to assign ownership and gather evidence?+−
The page is set up to help a practitioner identify the right data owner, collect the two datapoints, and assemble evidence for assurance. In practice, that means using the preparation steps and evidence pack to decide who provides each input and what documents support it.
Can I reuse data from GRI 404-2 Training and Education for ESRS S1 Own Workforce reporting?+−
The page notes ESRS S1 (Own Workforce) as the closest correspondence, so the same underlying data may be reusable. You should still check the specific reporting needs for each framework rather than assuming they are identical.
More questions this page can help with
GRI 404-2 Training and Education: what are the two datapoints I should ask my HR team for?GRI 404-2 Training and Education evidence pack: what should I put in it for assurance?GRI 404-2 Training and Education common mistakes: what should I check before sign-off?GRI 404-2 Training and Education workbook download: how do I use the .xlsx file?GRI 404-2 Training and Education draft disclosure: what can I lift into my report?GRI 404-2 Training and Education synthetic example: how do I adapt the example to my own data?GRI 404-2 Training and Education assurance claims: how do I test claim, risk and evidence?GRI 404-2 Training and Education content index line: what should I include in the index?GRI 404-2 Training and Education visualisation ideas: how can I present the data clearly?GRI 404-2 Training and Education from company reports: how do I use the linked examples?GRI 404-2 Training and Education ESRS S1 correspondence: can I reuse the same source data?GRI 404-2 Training and Education preparation checklist: what should I do first?
How this library is built
312 published reports indexed
63171 pages with page-level citations
272 practitioner guides
Free · LRA Community
Get your GRI 404-2 tools — free
Your preparation tools are free for LRA Community members and students. Register once (it's free) and your download starts right away — plus the Disclosure Library, templates and the LRA AI Assistant.
✓
You're in — your download is starting
Your file is downloading now. Your Community Cabinet — with the Disclosure Library, templates and the LRA AI Assistant — is ready too.
Open your Cabinet →