


Disclosure focus
This disclosure asks an organisation to explain the processes and policies it uses to identify, assess and manage climate-related risks. In practice, the report should show how climate risk is built into decision-making, what internal rules or procedures are in place, and who is responsible for applying them. The emphasis is on describing the organisation’s approach clearly, rather than listing isolated actions.
The practical focus is usually on whether these processes and policies apply across the whole organisation, including relevant operations, business units and locations, rather than only at a few flagship sites. A useful explanation would make clear the scope of coverage, any differences between parts of the business, and how consistently the approach is applied in day-to-day management.
This LRA educational guidance supports disclosure preparation. For the exact requirements, always refer to the official IFRS source.
Before you start
A quick mental checklist before you prepare this disclosure — tick each as you settle it.
Preparation
Key datapoints to prepare
+ Show s2-25-a sub-elements (LRA working checklist)
Explain any year-on-year changes in the figures or information you report.
State where the data comes from and what boundary or coverage it includes.
Set out how often you review or track the matter.
Describe the policies or procedures you use to manage it.
Show the basis you use to decide what gets attention first.
Set the criteria or cut-offs you apply to judge risk.
If you use scenarios to spot risks, explain how they feed into that assessment.
How to prepare it
1Set the boundary first: decide which parts of the business, value chain, or reporting period are in scope for this disclosure, and make that choice clear in your working papers.
2Define the terms you will use for the report: explain what counts as a relevant source of information, what sits inside the scope, and how you will treat any screening, ranking, or scenario-based inputs used to identify risks.
3Gather the support behind each point: keep the underlying records that show the information came from the chosen sources, the monitoring rhythm used, and the policies or procedures that guide the process.
4Build the disclosure from those records: prepare the figures or narrative so it reflects the way risks were identified, the criteria or cut-offs applied, and the logic used to decide what was prioritised.
5Record anything that changed or was left out: note differences from the previous year, explain exclusions, and describe any shifts in sources, scope, methods, or assumptions so the reader can follow the trail.
6Check the draft against the official source before sign-off: confirm the wording, scope, and evidence line up with the standard and that nothing material has been missed or overstated.
Request the data
Request the climate-risk process evidence from Risk
Translate the disclosure into an internal business question — then adapt it to your organisation's own language.
How do we currently identify, assess, prioritise, monitor, and update climate-related risks, and what changed since last year?
Use your organisation’s own names for risk frameworks, control cycles, review forums, and scenario work first; then map them to the disclosure fields below. Keep the ask in business language that your risk team already uses, and check the official source before sign-off.
Weak request
Please provide the climate-risk policies and processes disclosure evidence.
Why it fails: This uses framework language only, so the owner may not know which internal documents, systems, or review cycles to pull. It also does not specify scope, period, source, or the exact business questions needed to assemble the evidence.
Better request
Please send the latest pack your team uses to identify, rank, and review climate-related risks for [reporting period], including the documents, register extracts, committee papers, and scenario notes that show the scope covered, review cadence, ranking logic, thresholds or triggers, and what changed since last year.
Industry examples
Draft your disclosure
Notes that turn data into a disclosure
LRA training templates — adapt them to your organisation, and check the official source before sign-off.
Method note
Set out the basis used to prepare the disclosure, including the definitions applied, the data inputs relied on, the scope covered and the review rhythm used to keep the information current.
Context note
Explain what the figures are intended to show in practice: how the organisation identifies climate-related risk, what drives the ranking of issues, and how the chosen thresholds and scenario work shape the results.
Fluctuation statement
If there are notable year-on-year movements, describe whether they come from changes in the underlying data, the scope of what was included, the way risks were assessed, or the timing of the review process.
Content index entry
s2-25-a Climate-risk processes and policies — [location / page] / [notes]
Download Centre
Preparation tools & forms
Professional preparation tools for s2-25-a — free with an LRA Community membership. Register once (it's free) and every download unlocks, together with the Disclosure Library, templates and the LRA AI-assistant.
Free · Community members
Assurance readiness
For each claim, check the evidence
Evidence pack to prepare
Common reporting gaps
The information is presented without a date or as-at point.The scope or boundary of the statement is left undefined.Key terms are used inconsistently across the report.Material changes since the previous period are not disclosed.Assertions are made without supporting detail or a source record.Boilerplate is used that does not actually answer what is asked.
Common gaps
Mistakes to avoid when collecting the data
Wrong owner
The request goes to the wrong team, so the answer comes from a group that does not actually run the climate-risk process or keep the supporting records.
Framework language used
People ask for the information in reporting jargon instead of the organisation’s own terms, and the source team cannot map it back to the way they work.
Scope not pinned down
The collector does not state which business areas, entities or activities are in scope, so different teams send data for different populations.
Timing basis mixed up
The team pulls information from the wrong period or uses a different cut-off date from the one used elsewhere, which makes the set inconsistent.
Counting basis blended
Inputs are combined even though they were built on different counting methods, so the final figure no longer matches any source record.
Source labels lost
Original file names, system tags or local labels are stripped away during collection, making it hard to trace each item back to where it came from.
Separate groups merged
Data for distinct populations is rolled together when it should stay separate, which hides differences in how the process works across the organisation.
Evidence details missing
The collector saves the answer but not the supporting metadata, so later reviewers cannot see when it was captured, by whom, or from which source.
No approval trail
The draft is passed on without a clear sign-off record, so nobody can show who checked the inputs before they were used.
Where judgement is often needed
How to handle a year of portfolio reshaping
If acquisitions, disposals or other boundary moves changed the business mix during the year, explain the cut-off date and whether you restated or left prior-period figures as reported.
Which country rule set to use where local practice differs
Where the same control or threshold is defined differently across jurisdictions, state the rule set you applied, why it was chosen, and whether any local variations were kept separate.
Where to draw the line for near-boundary activities
For activities, sites or teams that sit close to the reporting perimeter, set out the inclusion rule you used and disclose any borderline cases that were included or left out.
Whether the process is described on a current or average basis
If the approach changed during the year, say whether you described the position at the reporting date or used an average view, and explain the basis for that choice.
When to use estimates instead of direct records
If complete operational records were not available, identify the parts built from estimates, the source data behind them, and the main assumptions used.
How much detail to show after rounding
If figures or counts were rounded, make clear the rounding convention and ensure the narrative still matches the underlying totals and sub-totals.
How to aggregate sensitive location or people data
Where privacy, security or confidentiality limits the level of detail, group the information at a higher level and explain the aggregation rule so the scope remains understandable.
How to treat a control that is partly outsourced
If monitoring, review or escalation sits partly with a third party, describe which parts remain in-house, which are outsourced, and how you decided they belong in the process description.
Whether scenario work is used for every risk or only selected ones
If scenario analysis is applied only to certain climate risks, state the selection rule and explain how that links to your prioritisation and threshold setting.
Examples
Illustrative examples
Synthetic, written by LRA — not from a company report, not text from any standard.
Illustrative (synthetic) example — Electricity generation
We use a mix of internal incident logs, plant telemetry and selected supplier data to spot climate-related risks across our owned sites and key contracted operations, and we review the picture monthly with a quarterly deep-dive for the board and its committees. Since last year, we have widened the scope to include two additional gas turbines and one battery storage asset, and we now rank issues using a simple score that combines likelihood, financial exposure and recovery time. - We treat a risk as material for screening when the score reaches 12 or more on a 20-point scale, or when expected outage time exceeds 72 hours. - We test the most exposed assets against two future weather pathways to see whether flooding, heat stress or water shortage could trigger or worsen the risk, and we use those results to decide which items move into our formal risk register.
Synthetic illustration only. It shows how a company might describe the information it uses, how often it checks it, what changed from the previous year, how it decides what to focus on first, the trigger levels it applies, and how forward-looking weather analysis feeds into risk spotting.
Illustrative (synthetic) example — Food manufacturing
Our screening draws on factory maintenance records, supplier questionnaires, insurance claims and site walk-throughs, with checks every two weeks and a formal management review each quarter. Compared with the prior year, we added three co-packing lines and one cold-store facility to the scope, and we now sort issues by combining safety impact, supply interruption risk and time to restore operations. - We flag an item for escalation when the combined score is 10 or above on a 15-point scale, or when a single event could stop production for more than 48 hours. - We also run two climate pathways through our risk workshops so we can see whether heat, drought or storm disruption would change the order of priorities or bring a new issue into view.
Synthetic illustration only. It demonstrates a different reporter’s way of explaining the sources it relies on, the parts of the business covered, the frequency of review, what changed from the previous period, how it decides what matters most, the thresholds that prompt escalation, and how scenario analysis supports risk identification.
How companies report s2-25-a
Real reports where this topic is disclosed. These are report practice, not exact disclosure templates to copy.
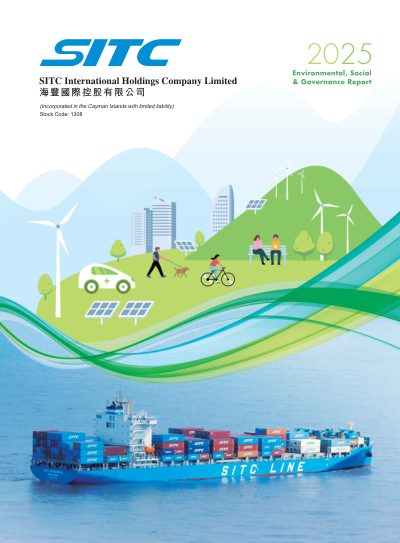
SITC International Holdings Company Limited
Water Transportation · Hong Kong · 2025
SITC International Holdings Company Limited’s 2025 Environmental, Social and Governance Report provides evidence on its processes for identifying and assessing climate-related risks, including the use of climate-related scenario analysis to inform risk identification (p.179, p.190). The report also details the data sources and scope of operations covered in these processes (p.190) and outlines policies related to energy conservation and environmental protection (p.179). However, the report does not clearly disclose changes from the prior year or the monitoring cadence, and the prioritisation logic and risk criteria thresholds are mentioned only in unclear or partial terms (p.194, p.196).
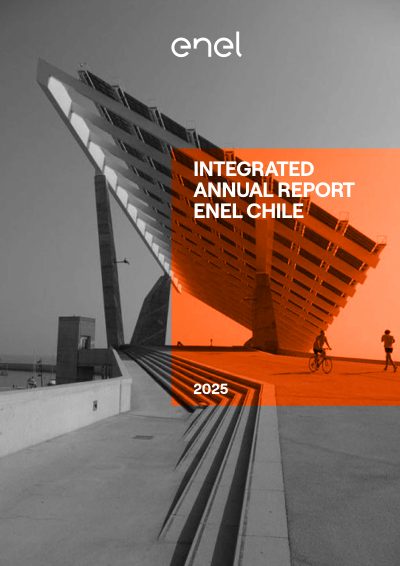
Enel Chile S.A.
Electric Utilities / IPP / Energy Traders · Chile · 2025
Enel Chile S.A.'s 2025 Integrated Annual Report provides evidence of policies and processes related to climate change and the energy transition integrated into the Group’s activities (p.51). The report also includes the use of scenario analysis for identifying climate-related risks (p.373). However, disclosures on changes from the prior year, clear data sources and scope, monitoring cadence, prioritisation logic, and specific risk criteria thresholds remain unclear or not found within the report (pp.146, 152, 372).
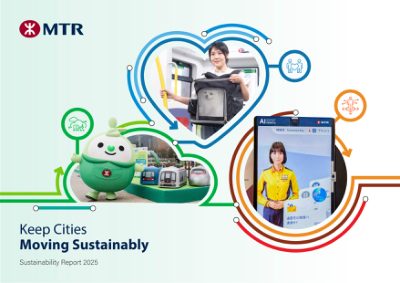
MTR Corporation
Ground Transportation — Railroads · Hong Kong · 2025
MTR Corporation’s 2025 Sustainability Report shows that climate-related risks are monitored, reviewed, and updated annually through their Enterprise Risk Management Framework, with oversight by the Risk Committee, Executive Committee, and Board-level Audit & Risk Committee (pp.13, 82). The report includes references to risk dashboards and quantitative key risk indicators supporting risk oversight (p.13), and mentions climate-related risk assessment methodologies and findings (p.83). However, the report does not provide clear disclosures on changes from the prior year, data sources and scope, monitoring cadence, prioritisation logic, risk criteria thresholds, or the use of scenarios in risk identification.
✓ LRA AI Assistant · Human-in-the-loop

Ask Study Studio AI assistant about this disclosure
Get practical answers for your reporting context. Your first two answers are free — join LRA Community for free to continue without a limit.
TryHow do I prepare s2-25-a?What data do I need to collect?Where can I see a real-report example?What mistakes should I avoid?
2 free answers
Check your understanding
Scenarios to work through
A group updates its climate-risk playbook after a severe weather season. The risk team has new supplier data, a revised review timetable, and a changed way of ranking issues, but the draft note only says the process was refreshed.
QWhat should the preparer do so the disclosure is useful to readers comparing this year with last year?
Reveal model answer →Hide answer ↑The note should spell out what changed from the previous year in the way the organisation handles climate-risk work, rather than using a vague statement that the process was refreshed. It should make clear which parts of the approach were altered, so readers can see the movement over time.
Why this matters · Readers need a clear description of year-on-year movement in the climate-risk approach, not a generic update label.
A finance team wants to describe climate-risk controls using only the central register, because that is the easiest source to pull from. However, the sustainability team also uses site-level logs, board papers and a supplier-screening tool, and those sources cover different parts of the business.
QHow should the preparer decide what to include about the information base and the part of the business covered?
Reveal model answer →Hide answer ↑The disclosure should explain which information feeds the process and what part of the organisation those inputs cover. If more than one source is used, the preparer should describe the main ones and the scope they cover, so the reader understands the basis for the climate-risk work.
Why this matters · The explanation should show both the information base and the coverage of that base.
A company reviews climate-risk indicators every month, but only escalates them to senior leaders once a quarter unless a trigger is hit. The draft disclosure says the issue is monitored regularly, without saying how often or what happens between reviews.
QWhat level of detail should the preparer give about the review pattern?
Reveal model answer →Hide answer ↑The preparer should state the review rhythm in plain terms, including how often the issue is checked and whether there are different steps for routine review and escalation. A reader should be able to tell how the monitoring works in practice, not just that it happens.
Why this matters · The cadence of review should be understandable from the disclosure, including any different timing for routine and escalated checks.
A risk committee uses a scoring model to decide which climate threats get attention first. The model gives extra weight to operational disruption and legal exposure, and anything above a set score goes into the top tier, but the draft only says the committee prioritises material matters.
QWhat should the preparer explain about the way climate risks are sorted and filtered?
Reveal model answer →Hide answer ↑The disclosure should describe the logic used to rank and filter climate risks, including the main factors and any cut-offs or thresholds that move an item into a higher priority group. That lets readers see how the organisation decides what gets attention first.
Why this matters · The prioritisation method should be transparent enough for a reader to understand the ranking rules and any trigger points.
Framework references
Related framework references
How this disclosure maps across the major reporting frameworks.
Primary
Related & explore
FAQ
Questions this page answers
How do I use the s2-25-a page to draft the disclosure from scratch?+−
Start with the plain-language explainer and the step-by-step preparation section, then use the datapoints list to check what evidence you need. The draft-output section also gives narrative starters, visualisation ideas and a content-index line you can adapt into your own draft.
What data do I need to collect for s2-25-a before I can write the disclosure?+−
The page points you to year-on-year changes, source systems and boundary, review frequency, relevant controls and rules, selection and ranking logic, risk cut-offs, and how scenario analysis is used. Use those datapoints as your collection checklist so you can build a complete evidence pack.
How should I decide the boundary and source systems for s2-25-a data?+−
The page tells you to capture the source systems and boundary as part of preparation, so the key is to be explicit about where the data came from and what was included. That helps the disclosure stay traceable and makes assurance easier.
Who should own the s2-25-a disclosure process in practice?+−
The page is set up for sustainability/ESG managers, HR or data owners, and assurance reviewers to work from the same material. In practice, ownership should sit with the person coordinating the disclosure, with data owners and reviewers feeding into the evidence pack and checks.
What should go into the evidence pack for s2-25-a assurance readiness?+−
The page includes an evidence pack with five items, plus six assurance claims to verify using claim, risk and evidence. Use those together so each key statement in the disclosure can be traced back to supporting material.
What are the common mistakes to avoid when preparing s2-25-a?+−
The page lists common reporting gaps and mistakes, so it is useful as a pre-submission check. Use it to spot missing boundary detail, weak methodology explanation, or unsupported narrative before you finalise the draft.
How do I use the Prep & Assurance workbook for s2-25-a?+−
The Download Centre includes a Prep & Assurance workbook in .xlsx format, which is there to help you organise the preparation and assurance work. Use it alongside the page’s datapoints, evidence pack and assurance claims to turn raw inputs into a draft.
What can I take from the printable Library Card PDF for s2-25-a?+−
The Download Centre also provides a printable Library Card in PDF format, which is a handy reference when you are working through the disclosure. It is useful for keeping the key preparation points, evidence needs and draft-output prompts in one place.
Can I use the synthetic example on the s2-25-a page as a template for my own disclosure?+−
Yes, but only as a synthetic illustration. The example is there to show how a disclosure might look, including a quantitative table, so you should replace it with your own internally consistent data and wording.
How does the ESRS E1 correspondence help me with s2-25-a data?+−
The page says the closest ESRS correspondence is ESRS E1 (Climate Change), so that can help you think about where similar data may already exist. Treat it as a reuse opportunity for data, not as a statement that the requirements are identical.
More questions this page can help with
s2-25-a disclosure checklist for sustainability managers2-25-a what evidence do I need for assurances2-25-a workbook download how to use its2-25-a common mistakes and reporting gapss2-25-a boundary source systems methodologys2-25-a draft narrative starters and content indexs2-25-a year-on-year changes data collections2-25-a review frequency controls and ruless2-25-a selection and ranking logic risk cut-offss2-25-a scenario analysis use in disclosures2-25-a evidence pack five items assurance readys2-25-a from company reports examples page
Free · LRA Community
Get your s2-25-a tools — free
Your preparation tools are free for LRA Community members and students. Register once (it's free) and your download starts right away — plus the Disclosure Library, templates and the LRA AI-assistant.
✓
You're in — your download is starting
Your file is downloading now. Your Community Cabinet — with the Disclosure Library, templates and the LRA AI-assistant — is ready too.
Open your Cabinet →